Showing posts with label Evolution of Oil Demand. Show all posts

Monday, January 25, 2010

Regular Car, Premium Gasoline

An increasing number of regular looking vehicles in the US are requiring high octane premium gasoline.  These vehicles include the tiny Smart fortwo and a variation of the Volkswagen Jetta.


Is this premium fuel requirement a stealth move for some auto manufacturers to gain market share?  Has this increased sales of high octane gasoline relative to regular octane gasoline in the US?

Octane Ratings Explained
Octane ratings are the numbers printed on a gasoline pump often labeled regular, midgrade and premium.  In the US regular gasoline is greater than 85 and less than 88 octane, midgrade is equal to or greater than 88 and less than 90, and premium is equal to or greater than 90. In Europe and Asia the number on the pump for equivalent fuel is usually 5 points higher.  In other words 87 on a pump in the US is equivalent to 92 on a pump in the UK.

Octane rating has little to do with the energy content of the gasoline.  It has all to do with how much volume of the gasoline can be squeezed, or compressed, into an engine cylinder without the gasoline igniting before the spark plug fires.  Gases heat up when compressed and gasoline engines are tuned to compress the gasoline as much as possible without compressing it so much the fuel burns without a spark plug.  The goal is for the timed and synchronized spark plug to ignite the fuel when a piston reaches the top of the combustion chamber.  If ignition due to compression (rather than the spark plug) occurs then an engine can be damaged. 

Many new cars requiring high octane fuel can tolerate slightly lower octane because their computers adjust for the less compression ignition resistant fuel, but there is typically a lower power output and one should only do this if a vehicle manufacturer says it is ok for your engine.

As gasoline with higher octane ratings resists compression more than regular can be added to the combustion chamber on each stroke of the engine.  This higher compression tolerance allows more more gasoline to be burned and more power on each stroke.  This is why racing cars use high octane gasoline.

Why don't all cars use high octane gasoline? There is a substantial incremental cost for a refinery/gasoline blender to raise the octane of gasoline.  Higher octane requires expensive gasoline blendstocks and consumers are sensitive to increased gasoline prices. 

The additional fuel cost to a driver for high octane gasoline compared to regular is around US$100-US$200 each year (based on 10,000 miles per year in a 25MPG vehicle).

Should one fill up with higher octane than a vehicle manual suggests?  No.  It will likely be a waste of money without any improvement in performance.  If your vehicle manual recommends regular octane then just use regular. 

Use high octane gasoline if you have a vehicle with a high compression engine and your vehicle manual recommends it.  However, as mentioned above, some vehicle manufacturers say their engine computers can adjust to handle lower octane rated gasoline.

High Octane Gasoline No Longer just for Sports Cars
In the past high compression gasoline engines were primarily used in sports cars and luxury high performance vehicles.  Now more vehicle manufacturers are putting high compression engines into what would not generally be perceived as being a sports car.

One reason vehicle makers are doing this because it improves the statistics consumers look at when purchasing a vehicle.  A high compression engine running on premium will accelerate a vehicle from 0 to 60 MPH faster than a low compression engine.  Consumers rarely ask a car dealer which octane rating of gasoline a vehicle burns.  They do ask how quick the vehicle acceleration is from a standing stop and on a test drive will notice the peppiness and responsiveness of a high compression engine. 

Has Demand for Premium Gasoline Changed?
In summary, the number of vehicles requiring premium (high octane) gasoline (rather than midgrade or regular) has been increasing in the US because vehicle manufacturers have realized that high compression engines can increase vehicle sales by enhancing the statistics consumers look at and the test drive experience.  One could surmise, therefore, that the percentage share of premium gasoline being sold in the US has been steadily increasing as these new vehicle owners dutifully follow vehicle manufacturers' recommendations. 

The data shows that most of these high octane requiring vehicles are being filled with lower octane fuels.  The percentage of premium relative to total gasoline sales has been steadily falling (see chart below): 

(click chart to enlarge)

It is likely the nod from some vehicle manufacturers that onboard computers can adjust newer high compression engines to handle lower octane gasoline that gives comfort to some owners.  Another way of looking at the data is that these new, often unsuspecting, high compression engine owners are attempting to save at the pump having hastily splurged on a sprightly engine.

(Why is "octane" the name used for the compression resistance of gasoline?  Read Oil 101, Chpt. 9)

Friday, January 22, 2010

Oil Creates Decennis Horribilis for Airlines

How long can an entire industry operate at a loss?  For the airline industry it is ten years and counting.  The primary reason for airline woes has been high oil prices.

Airlines globally will spend close to US$150 billion on jet fuel this year.  The global airline industry is expected to lose US$5.6 billion during 2010 if oil prices average US$75 per barrel (basis ICE Brent crude).  This follows an industry loss of US$11 billion in 2009 capping a decade of losses:
"Between 2000 and 2009, airlines lost US$49.1 billion, which is an average of US$5.0 billion per year,” said Giovanni Bisignani, IATA’s Director General. (source)
The jet fuel share of total costs spent running global airlines has roughly doubled since the early part of the decade:
2000  14%
2001  13%
2002  13%
2003  14%
2004  17%
2005  22%
2006  24%
2007  28%
2008  32%
2009  26%
2010  26%*
*IATA Forecast

Monday, January 18, 2010

Oil Efficiency Falls in Importance, Perhaps

Oil market participants are curious to know whether oil efficiency is becoming more important to consumers buying new vehicles. Consumers say no. In fact, they say its importance is diminishing.

Consumer Reports' 2010 Car Brand Perception Survey has just been released.  The US survey was conducted in December 2009.  Safety, quality, value and performance remain the primary factors of interest to consumers according to the 2010 survey.  Efficiency, called the 'environmentally friendly/green' factor in the survey, fell 8 percentage points from 40% in 2009 to 32% in 2010.  As Consumer Reports says:
"In a troubled economy, with gas prices relatively low, green in the wallet trumps environmental concerns."
In short, the Consumer Reports' Survey indicates that the greater than two year efficiency drive which occurred in the early 1980s is not being repeated at present. Instead, 2008-2009 oil demand destruction may be more like the 1973-1974 efficiency drive which quickly evaporated.

The oil market is now receiving conflicting data from US oil consumers.  The percentage of newly purchased vehicles being cars is increasing versus SUVs and light trucks, but according to the Consumer Reports' survey consumers are saying that efficiency is less important.  Perhaps it is the wording of the Consumer Reports survey which is creating the conflict with actual US vehicle purchase data?  Perhaps we should watch what consumers do rather than what they say?

(See Oil 101 for more on prior oil demand destruction periods.)

Monday, January 11, 2010

A Car Story

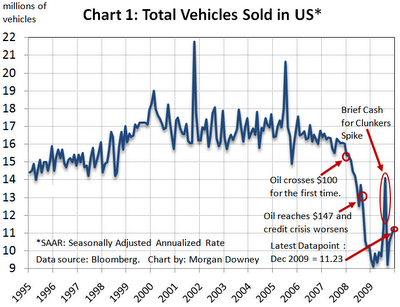
Whither the future of oil demand?  A major component in forecasting future oil consumption involves analysis of the number of installed devices (cars, trucks, aircraft and ships) capable of burning oil.  Following the recession the pace of US auto sales recovery is outpacing many analysts' expectations (chart 1):

(click to enlarge)

US consumers are continuing their trend toward purchasing more efficient vehicles.  The percentage of cars sold is increasing instead of light trucks and SUVs (chart 2):

(click to enlarge)

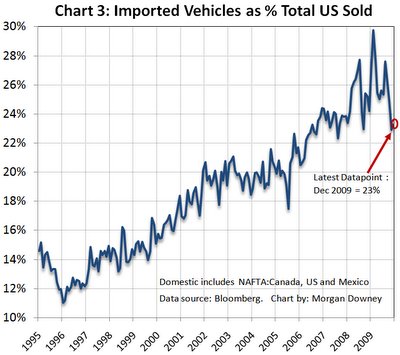
US auto makers also seem to be gaining ground in relation to foreign auto makers (chart 3).  As I mentioned a few months ago, there are firm reports that US consumers perceive there to have been large quality gains from US auto makers.

(click to enlarge)

The US is not alone in having increased auto sales.  Chinese consumers have been purchasing more vehicles than US consumers on a monthly basis since September 2009 (chart 4). 

(click to enlarge)

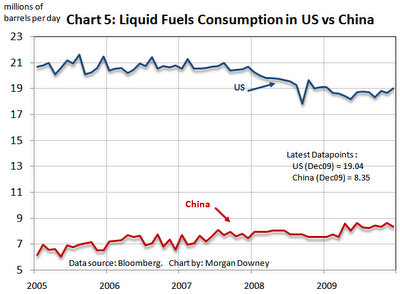
The installed base of existing vehicles in the US means that the US still consumes more than twice the amount of oil as China (chart 5).  If the Chinese economy sustains an annual compound growth rate of 8% in vehicles sales then it will be 12 years from now in 2021 that China will consume roughly the same amount of oil as the US does today.  To put the US and Chinese numbers in perspective, global consumption of oil is currently around 85 million barrels per day.

(click to enlarge)

Thursday, December 3, 2009

Dargay/Gately on Modeling Oil Demand

Year end is the season given to updates of long-range oil supply and demand forecasts, particularly from the OECD's International Energy Agency (IEA) and the US Energy Information Administration (EIA).  Many models used for forecasting rely on extrapolating past patterns.  However, is such a method reliable if those patterns reflect unrepeatable structural changes?

Is the oil demand pattern over past 40 years a reliable indicator of what may occur in the future? Or, as a very interesting research paper just released by NYU Professor Dermot Gately and Joyce Dargay of the Institute of Transport Studies at the University of Leeds in the UK indicates, has there been a one off structural change in the use of oil which if ignored and not backed out of past patterns could create a very large under estimation of potential oil demand? 

The one off structural change in oil demand was the global shift away from using oil for electrical power generation over the past 40 years.

Following is a summary of the paper in my words:

Dargay/Gately find that much of the efficiency in oil consumption in OECD countries since 1970 was due to oil being effectively phased out as an electricity generation fuel. The oil saved from electicity generation was used in transport. Transport demand for oil facilitates economic growth and is thus highly correlated with economic growth.

Now that this shift away from oil being used for electricity generation has been completed, growth in Total oil demand is going to be much more highly correlated to economic growth than it has been since 1970. Because of this, one cannot use growth in Total oil demand since 1970 as a predictor of future oil demand growth. Instead, growth in Total oil demand is likely to be higher than the 1970-today period.

Oil demand in 2009 is just over 84 million barrels per day (mbd). A major reason for the difference between the Dargay/Gately demand number by 2030 of 134 mbd and the IEA forecast of 105 mbd is due to Dargay/Gately incorporating the fact that the one off switching effect from electicity use to transport use cannot be repeated. Dargay/Gately are not stating that supply of 134 mbd or 105 mbd will be available. They are simply looking at the demand side of the equation and saying that if economic and population growth progresses as the OECD forecasts then the oil demand this implies is likely to be a lot higher than the IEA's forecast of 105 mbd.

The conclusion I take from Dargay/Gately's paper is that if supply is not available to meet this 134 mbd oil demand then economic growth cannot progress as the OECD forecasts and/or an extremely large and unprecedented change in the level of oil consumption efficiency will have to take place between now and 2030. This efficiency will likely be driven by high oil prices.

(click on Fullscreen below to enlarge)

Tuesday, December 1, 2009

IEA to Japan: 85MPG by 2030

The OECD International Energy Agency (IEA) is the taxpayer funded energy advisor to the 28 most developed countries. The agency was created in 1974 by large oil consuming nations in response to an oil supply embargo which began in late 1973.

The IEA publishes an annual World Energy Outlook (WEO) each November. See a video of the 2009 WEO press conference here.

One of the conclusions which can be drawn from deconstructing the 2009 WEO, the IEA's forecast of energy supply and demand out 20 years to 2030, is that the IEA estimates that the average new vehicle sold in Japan in 2030 will have to attain on average 85 miles per gallon. Even small motorcycles cannot get close to that level of efficiency in everyday use today. Those 2030 Japanese vehicles will have to be plug in hybrids and Japan will have to build electrical capacity to handle this demand.

Oil supplied to the global market in 2009 is just over 84 million barrels per day (Mbpd). The big headline grabbing number in the WEO report this year is that the IEA believes global oil supply in 2030 will be around 105 Mbpd. Although the IEA's 105 Mbpd 2030 supply forecast is down significantly from previous WEOs it will still require the discovery and development of at least four Saudi Arabian sized oil producing areas before 2030. This huge challenge is the IEA's basic "reference scenario".

What most people are interested in from a modeling perspective is the logic and assumptions the IEA uses. In this regard, this years IEA supply side estimate methodology appears to have a certain predictability.

In fact, let me pull up an old chart of mine showing oil supply at 4.6 barrels per year per capita over the past 27 years (see chart below). What does the IEA 2009 WEO forecast for 2030? You will not be surprised that it is almost exactly 4.6. Plug in the current global population and UN population growth estimates between now and 2030 et voila: IEA global oil supply estimates almost to the barrel.

(click chart to enlarge)

There is nothing wrong with using 4.6. Using 4.6 is a reasonable starting point for modeling required oil supply. Remember that the IEA's basic supply side case to get to the 4.6 number assumes at least four Saudi Arabias will be among those discovered and developed over the next 20 years - a whopper of an assumption. Estimating actual oil supply out 20 years is much more challenging given that most of the oil which will be supplied in 2030 has not yet been discovered.

The IEA goes on to estimate how the 4.6 barrels per year per person globally will be broken out by geographic region on the demand side of the oil equation. Their conundrum is that if China, India and other non-OECD countries continue to grow as expected then someone else has to reduce oil consumption through voluntary or forced efficiency. The IEA is forecasting per capita oil consumption efficiency improvements of just over 20% in each of the US and OECD Europe. Amazingly the IEA is forecasting per capita efficiency of around 40% for Japan. This is after taking into account population changes. These efficiency numbers are the IEA requirements under their basic "reference scenario".

Another interesting point to note is that the IEA WEO forecasts non-OECD (which includes China and India) per capita oil demand to only increase by a total of 14% between now and 2030 despite forecasting compound annual economic growth of around 5% per year for non-OECD countries. This implies extremely large per capita oil demand efficiency, greater than Japan's 40%, in the non-OECD developing world.

What will cause this efficiency: climate change legislation, slower than expected economic and/or population growth, availability of niche alternatives such as CNG and electric vehicles or persistently high oil prices? It will be a combination of all these but most likely will be as a result of high oil prices. The IEA WEO report forecasts oil prices rising to an average of US$100 by 2020 and US$115 by 2030 (in year-2008 dollars). However, based on an analysis (see pages 15 and 16 of Oil 101) of rare past periods of oil consumption efficiency it is unikely that the IEA's price forecasts are sufficiently high by a long shot to create the required efficiency.

What to do? It cannot be stressed any more how the winners in the IEA reference scenario to 2030, which many outside the IEA see as too optimistic, will be those that get ahead in terms of efficiency. Reacting to oil prices is by definition too late. That is why a Vehicle Efficiency Market is the least painful way for individual countries to gain advantage. We have to create an economic incentive to become more efficient independent and ahead of oil prices.

Tuesday, November 24, 2009

Is the Future of Transport in Niches?

Transport occurs in fairly stable patterns.  People commute to and from work, school and stores each day within a known range of miles and load. However, these stable patterns do not define the vehicles people buy. People tend to buy vehicles which cover a large array of contingencies.  Daily commuter vehicles are more often than not heavier than needed for a daily commute as they are purchased for events such as a once every month journey more than 200 miles with 6 people.  This contingency-link to vehicle purchasing creates a lot of fuel inefficiency.


(source: US Census Bureau)

As transport fuels become more diverse and expensive, powered transportation devices may also become more customized to fill niches.  These niche vehicles will be more efficient as they would just cover the vast majority of daily transport in the most efficienct manner.  Services such as car sharing Zip Car would meet the need for less frequent vehicle uses.

In cities, people tend to use taxis, subways and buses.  Taxis are expensive. Subways and buses, while most often the quickest way around, can be slow and infrequent at the edges of a city.

I was passing a motorcycle store the other day and saw this Ultra Motor A2B electric bicycle which can travel 20 miles at 20 miles per hour between charges.  It is an urban commuting vehicle.  One can pedal if the batteries have been drained.  The vehicle can be stored inside an apartment or an office which is an advantage over gasoline-powered scooters.  I am not endorsing this bike, it is simply interesting that products which would once have been considered gimmicks are now slowly at the edges of becoming more mainstream.

Sunday, November 8, 2009

World Oil Demand in Motion

When data is put in motion over time it becomes more interesting.  I have added World data to the Oil Demand Motion Chart. You can look at this chart any time from the link on the right side of this web site.  The oil data comes from the BP annual statistical review.  The population data is from the UN and the GDP data is from the World Bank.

Some interesting observations one can take from the chart are: 1. the evolution of oil demand in developing nations (click on Korea); 2. how developed nations oil consumption per capita is relatively stable (click on the US or UK); 3. that world oil demand has stuck at around 4.6 barrels per person for over 26 years despite huge population and economic changes over that time (discussed here previously).

I will be adding a lot more data to this chart over the coming weeks, especially some future oil demand scenarios.

The inspiration for the oil demand motion chart came from Fig. 1-13 on page 18 of Oil 101.

Thursday, November 5, 2009

Leading Edge Oil Demand Data

Is 2009 OECD oil demand destruction like 1974, when efficiency didn't stick, or the early 1980s, when efficiency almost bankrupted the oil industry? I have a much more detailed theory as to which version it is - which I will post at a later date. For now, let's dig into some data.

OECD oil demand growth is being written off by most oil analysts for the next few years. OECD demand growth is probably the most significant known unknown in the oil market. Early data indicates that we may be seeing signs of permanent OECD oil consumption efficiency. Given the huge numbers involved in OECD oil demand, it is worth teasing any data out for signs of how this efficiency is progressing and if it is lasting.

Automobile sales in the US are recovering (chart 1). The October sales numbers were at an annualized rate of 10.45 million units, up from 9.2 in September and 14.09 in August. The August number was prematurely high due to the cash for clunkers program which took place mostly in that month.

(click image to enlarge)

Now that the data dust of the cash for clunkers program has settled it is becoming clear that the mix between cars and SUVs/light truck sales is changing (chart 2). A higher share of car sales rather than heavier vehicles would tend to indicate that sticky changes in efficiency are occurring. Oil analysts factor these shifts into long term vehicles on the road when modeling oil demand. I speculated last month that the August cash for clunkers program had the effect of being a giant advertising program for efficient vehicles and would kick off this efficiency move.

(click image to enlarge)

What is interesting as an economic sidenote, but not so much for oil demand, is that US domestically produced automobiles appear to be gaining some ground (chart 3). Perhaps this is due to the weakness of the US dollar which makes imported vehicles more expensive as well as the recent report in an influential consumer survey of some US auto makers' vehicle quality improving.

(click image to enlarge)

Tuesday, October 20, 2009

Vehicle Purchasing: Value...not Brand

Vehicle brand loyality in the US is dead (NYTimes). The shift in vehicle purchasing considerations toward value and efficiency and away from brand identity could have a significant impact on US oil consumption over the next 5-10 years.

Monday, September 14, 2009

What is it about 4.6 barrels per year?

Cats are curious
(a friend of mine behind the computer screen)

Since 1982 the number of people in the world has grown by almost 45% or 2 billion people (chart 1).


Oil supply has been unable to outpace population growth since the 1970s and has from 1982 until recently just been able to keep pace with demand (chart 2). What can one person do with 4.6 barrels (193 US gallons) per year? With a vehicle getting 30 miles per gallon one can drive an average of around 16 miles per day.

Why has per capita consumption been so stable since 1982 having grown at an increasing pace for the prior 120 years (chart 2 again)? The answer is that a new method of rationing demand emerged in 1983: benchmark pricing linked to transparent free liquid markets (see chapter 1 of Oil 101). Free markets and necessarily volatile oil price became the adjusting factor matching available supply to demand.


To put the global average of 4.6 barrels of oil consumption per year in perspective, the number of barrels consumed per person in 2008 in India was 0.9, China 2.2, Brazil 4.6, Germany 11.1 and the US 23.3.

Build your own chart of consumption patterns over time by clicking here (click the 'Play' button to start and the individual country to track over time - set X axis to 'Time' and Y axis to 'Oil Barrels Consumed per Person').

Saturday, August 29, 2009

Oil Data Defines Recession Shape

It is widely accepted that the recession has ended.  Now the debate centers on the type of recovery. I wondered whether the shape of the current recession could be described with oil, or more precisely with oil demand via the number of miles driven on US highways.

Will the recession and recovery be classified as a V (sharp slowdown and equally sharp recovery), U (long trough between entering and exiting the recession), W (two V-shaped recoveries over a short period of time), or L (economic recovery takes a long time or perhaps never occurs) shaped recovery?

The chart below appears to indicate that the US is not going to suffer an L-shaped recovery, but instead is either in a U-shaped recovery or is perhaps on the first leg of a W-shaped recovery. The number of miles driven by US motorists would put the start of the recession at December 2007 and the end at April 2009. In fact, using oil demand data, one can pinpoint the precise nadir of US economic activity during the recession as the first week of October 2008.

Data for above chart from FHWA.  Grey bars indicate recessions defined by NBER.

Tuesday, July 7, 2009

Oil Demand over Time and Income

In the first chapter of Oil 101, figure 1-13 illustrates how oil demand per capita in an individual country initially evolves due to income changes until income reaches a European or North American level. Once per capita oil consumption reaches 1980 European or North American levels it ceases growing with income.

Page 18, Fig. 1-13, Morgan Downey, 2009, Oil 101

The chart below displays the same data as in Oil 101 but additionally shows the evolution over time. The question for oil forecasting is whether there is enough oil for China, India and other nations in the lower left corner to reach even European levels of oil consumption as their income grows.

(Notes for animated chart above: Vertical axis is annual income per capita. Horizontal axis is barrels of oil consumed per capita per year. The sizes of the circles are related to each nation's relative oil consumption. The chart may be more clear if expanded to your full screen size.)

The chart below is another variation on the same theme, allowing individual countries to be tracked (click on the relevant circle) as well as allowing the scale to be changed from linear to logarithmic. You can click on almost everything in this chart to change the view. Click on the 'Play' button to start the animation.

If you are having problems viewing the above chart or would like to open it in a separate window then click here.

Sunday, April 19, 2009

Modeling Oil Demand

When building oil supply and demand (S&D) models, demand is especially challenging to model when there are rapid large price movements.

When oil prices are relatively stable, consumers in developing countries increase their oil demand steadily with income until they reach European (high population density) or US (low population density) levels. Once consumers reach European or US demand levels then, in a stable oil price environment, oil demand in such countries becomes much less sensitive to income growth and changes only with population size.

However, in the face of rapid price increases such as that experienced in 2008, there is little historical data available describing how any oil consumer behaves. Data for the oil shocks of 1973-1974 and 1980-1983 are useful, but the world economy and transportation vehicle ownership patterns looked quite different back then.

Comparing patterns of vehicle ownership in different parts of the world today, I find it useful to have three model touchstones : 1. the US, 2. Europe (representing the developed world outside the US) and 3. the developing world.

1. The US has a high rate of vehicle ownership at 2.28 vehicles per household according to a recent survey. From the same survey, “'The most common pairing of vehicles in American households with two to four cars is a full-sized pickup truck and a standard, mid-range vehicle.” The average efficiency of the US vehicle fleet is in the low 20 mpg range.

2. Europe has slightly smaller levels of vehicle ownership per household compared with the US. Average European fuel efficiency is much higher than the US. Public mass transit is also more readily available in Europe than in the US.

3. In the developing world there is usually less than one vehicle per household and these vehicles are very efficient (such as a motorcycle/tiny car). Public mass transit is often much less available than in Europe and the US.

When oil prices rise rapidly, households in the US have capacity for immediate efficiency gains as they can drive the more efficient of their two vehicles more and if they buy a new vehicle they can buy a much more efficient vehicle. There is a certain amount of discretionary oil spending in the US (especially vacations involving air travel) which can also be cut back rapidly.

Europeans are already driving relatively efficient vehicles and so they have less capacity for immediate oil consumption efficiency apart from using public transportation more heavily. Europeans have less discretionary oil spending (as GDP per capita is lower) compared to the US - but what discretionary oil spending exists is still oil price sensitive.

In the developing world, there is less public transportation available and vehicle owners are already driving one very efficient vehicle. This vehicle is usually essential to getting to and from a good job and there is little oil spent on vacations (jet travel, and so on). Developing country oil consumers, therefore, have the least ability to cut back on consumption when oil prices rise.

In summary, when oil prices rise, households in the US can (to a certain extent) quickly decide to buy less oil, followed closely by Europe – but for slightly different reasons. In the developing world, households cannot as easily avoid buying oil when prices rise quickly.

This demand model was clearly evident in the rapid increase in oil prices during 2008 when US oil demand collapsed first and most severely (almost 13% year/year decline at its nadir in October 2008), followed by Europe. Developing world oil demand fell only very slightly, but quickly recovered.

Monday, April 13, 2009

The Evolution of Oil Demand

In Oil 101 I describe how oil demand evolves. As you can see from the chart below (from Chapter 1 - Oil 101), oil demand is initially strongly correlated with GDP. Then when oil demand gets to a certain level it tends to level off in per capita terms. In 1985, 24.45 barrels were consumed by the average US person. In 2008, the US average was 23.3 barrels even though population size and the economy had changed significantly.

Page 18, Fig. 1-13, Morgan Downey, 2009, Oil 101

Monday, March 23, 2009

Oil Demand Wave Crests Across Globe

China's General Administration of Customs released trade data for February on Monday March 23, 2009. As you can see from the chart above, China's apparent total oil demand grew by 0.5% in Feb 2009 versus Feb 2008. This is the first yr/yr growth figure to come out of China following three months of negative oil demand growth. The Lunar New Year fell in January this year and February last year, with distorts the numbers somewhat.

The Chinese data shows that the lag between the bottoming of US total oil demand (1st week of October 2008) and Chinese demand growth was four months. This appears to sync with market anecdotes of the wave length of the economic slowdown (and possible recovery) moving across the globe from the developed world to emerging markets.
 
Follow @CommodityMD