Ahead of OPEC members meeting Wednesday September 9 in Vienna, it is worth taking stock of why OPEC has no choice but to refrain from making any production changes and why they may in fact need a temporary tightening of compliance with existing quotas by up to 500,000 barrels per day in order to maintain prices above the low US$70s per barrel. Compliance with the 4.2 million barrels per day (Mb/d) cuts announced by OPEC members in late 2008 is currently around 3Mb/d.
--------------
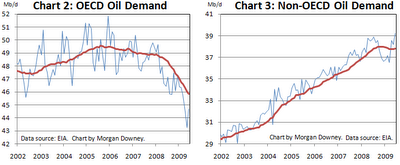
During the 2008-2009 recession global oil demand fell by 2 Mb/d from 86 to 84Mb/d (chart 1). Global demand appears to have stabilized and is beginning to grow again. The charts in this post (click to enlarge) use monthly data and 12 month rolling averages to adjust for seasonality.
Almost all the global decline was concentrated in developed OECD nations (chart 2). Less developed non-OECD nations such as China and India only saw a temporary stagnation and are now exhibiting growing demand again (chart 3).
Of the OECD decline, one third came from the US, one third from OECD Europe, and one third came from the remaining developed OECD countries.
The US accounts for just under 23% and Europe 18% of 2009 global oil demand. Oil demand in the US and Europe has yet to stop falling (see charts 4 and 5).
Oil demand in the US was destroyed more in absolute barrels over the past few years than in any other region.
The severe demand destruction in the US had a lot to do with current US oil consumption patterns (76% of Americans get to and from work by driving alone) and infrastructure (average US vehicle fleet efficiency is less than half that of available technology). Relatively inefficient consumption allows for swift efficiency gains compared with other parts of the world which are already at or close to maximum technically available oil consumption efficiency.
Looking at total US oil demand (chart 4) one may perceive that it is in a steady decline which can perhaps be extrapolated into the future. However, delving deeper into the data provides clues as to exactly why US demand is declining and why we may be at or quickly approaching the end of the decline in total US demand.
The total number of miles driven on US highways has stabilized and is increasing (chart 6).
This stabilization and increase in highway miles driven is showing up in US gasoline demand which is no longer falling and has begun to grow again (chart 7). Gasoline demand accounts for almost half US oil consumption.
The recovery in gasoline demand is because people are cutting back on vacation spending by driving rather than flying to holiday spots. This certainly syncs with the fall in jet fuel consumption (chart 8) and anecdotal evidence. Businesses have also been cutting back on flights.
The decline in jet fuel consumption is more than offset by the increase in gasoline consumption. Combined, jet fuel and gasoline demand (together 57% of total US oil demand) are beginning to recover (chart 9).
Where is the remaining weakness in US oil demand? It is in industrial oil demand. Demand for distillate (diesel and heating oil), residual fuel oil (mostly used for shipping and a little for electrical power generation) and other oils (lubes, waxes, asphalt, plastics and a bunch of other oils).
Aggregating these three categories of US oil demand into “Industrial” demand, these industrial oils account for 43% of total US oil demand (chart 11).
To see a recovery in US industrial oil demand there would have to be a recovery in consumer spending (linked to unemployment, housing and the savings rate), manufacturing activity (especially autos), and private services sector activity. Most indicators in these macroeconomic areas have begun to stabilize and even improve over the past couple of months.
Conclusion: US industrial oil demand is currently the weakest part of global oil demand and the largest component of global oil demand yet to cease declining. Non-oil macroeconomic indicators suggest that an end to the decline in US industrial oil demand is imminent.
Despite the weakness in OECD oil demand and US industrial oil demand in particular, global oil demand has stabilized and begun growing due to non-OECD demand.
So why have oil prices stabilized in the US$65-75 per barrel range if the reduction in demand has been plumbed at 2Mb/d and the fall is over?
At the end of 2008 OPEC members removed close to 3Mb/d from supply. This was the amount required to stabilize and reduce OECD land based storage. OECD land based storage is the easiest storage to track.
The problem with focusing on OECD land based storage which is no longer increasing is that it ignores difficult to measure global floating storage and non-OECD land based tanks. Floating storage (see chart below) and non-OECD storage continue to creep higher. There needs to be an elimination of inventory growth in these difficult to measure areas in order to hold the prices gains witnessed in 2009.
This elimination of inventory growth can come from the recovery of global demand which appears to be just beginning or a further reduction in supply from OPEC. The number required is around 0.5Mb/d.
At the OPEC meeting this coming Wednesday, September 9, OPEC members have no choice but to maintain existing production cuts. In fact, until nascent global demand growth strengthens, OPEC members may need a temporary 0.5Mb/day improvement in cut compliance (compliance with 4.2Mb/d cuts announced in late 2008 is only around 3Mb/day) in order to stall the increases in floating and non-OECD storage, bring the global market into balance (a balanced market has inventories neither increasing nor decreasing) and hold onto 2009 price gains.


