
As you may know from reading this blog, oil prices look like they will trade as high as US$95 before year end which will result in OPEC increasing production at their next scheduled meeting on December 22 in Angola. In other words, oil prices will continue higher until OPEC increases output.
OPEC have a relatively small amount of spare capacity and so once these production increases are done we will eventually see US$100+ oil again before the end of 2010.
Oil began 2009 close to US$30 per barrel. We are now at US$80 per barrel due to fundamental supply and demand. Oil bears have been blindsided in the past by an over-reliance on easy (OECD) data and OPEC double-speak. To help these oil bears out, here is a quick guide to the language of OPEC:
OPEC: Speculators are causing higher prices.
Means: OPEC wants, needs and causes higher prices by cutting output and creating an oil supply deficit. OPEC is the only group of oil producers with spare production capacity and has co-ordinated control of over 40% of global oil output - currently worth around US$3 billion per day, or US$90 billion per month.
OPEC: We think prices at US$70-US$80 are fair.
Means: OPEC will not increase oil production until oil trades above US$90 per barrel. OPEC members' target is US$70-$80, which means OPEC will increase production when oil trades above this range (perhaps to US$85-$95) to allow for some slippage. OPEC members do not want to encourage consumer efficiency or risk another recession with US$100+ oil, which is a psychologically important level for oil consumers.
OPEC: We cannot find buyers for our oil.
Means: OPEC members almost can't believe consumers are buying this line...but it actually worked when oil traded above US$100 last year because OPEC members had run out of spare capacity and were unable increase production.
OPEC: We do not want to increase production while OECD inventories are at record highs.
Means: Don't look at non-OECD inventories which are falling due to rapid demand growth in the developing world. Why do you think oil has risen from US$32 to US$80 over the past 10 months? If OPEC can keep consumers focussed on OECD inventories this allows OPEC to blame speculators and say "OECD inventories are high...it can only be speculators bidding oil prices up."
OPEC: Floating storage of oil is at record highs.
Means: It used to be that floating tankers were expensive and only used for storage when land-based tanks were full. Now these floating tanker owners are in such a bad way with a glut of tankers available that they are directly competing with land-based storage even though there is plenty of land based storage available. OPEC needs to point to any full barrel or container as an excuse not to increase production.
OPEC: We have almost 6 million bpd spare capacity.
Means: OPEC members have 2.5 million barrels per day (bpd) of spare capacity. The global oil consumer called OPEC members' stated spare capacity bluff in 2008.
Showing posts with label Floating Storage. Show all posts
Showing posts with label Floating Storage. Show all posts
Wednesday, November 4, 2009
Thursday, October 8, 2009
Floating Storage Sinking
A great story by Brian Baskin in the Wall Street Journal about the financial risks involved in storing oil. While storing oil on an opportunistic basis was common earlier in the year. The Journal story shows that in free markets such arbitrages only exist for brief periods:
"Storing oil is rapidly becoming a losing proposition...companies will find it difficult to extricate themselves.." (WSJ)


Wednesday, September 23, 2009
Ahoy Ahoy: Floating Storage Coming Ashore

Chart 1 shows total US oil inventories by week. Total US oil inventories increased by 8.5 million barrels. The second chart (Chart 2 below) shows US oil demand which looked as if it may have reached an inflection point over the past month (US gasoline demand is strong, offsetting weak diesel and jet demand).

One thought is that the increase in inventories could be oil in floating tankers coming onshore now that the forward curve is flattening which removes the incentive to store. So either the forward curve goes into steep contango again or flat price oil is about to fall (or a combination of both) as this floating material comes onshore. Or perhaps extrapolating a single week’s counter trend data point (the trend being falling inventories and higher prices) is not such a wise decision?
The last few weeks of September are always quite a volatile time for US demand and inventories. We are in the low demand shoulder period between driving and heating oil seasons. This week's numbers could be reflecting the data noise during this seasonal transition.
Tuesday, September 8, 2009
The End of Decline: Oil Demand Recovering
Ahead of OPEC members meeting Wednesday September 9 in Vienna, it is worth taking stock of why OPEC has no choice but to refrain from making any production changes and why they may in fact need a temporary tightening of compliance with existing quotas by up to 500,000 barrels per day in order to maintain prices above the low US$70s per barrel. Compliance with the 4.2 million barrels per day (Mb/d) cuts announced by OPEC members in late 2008 is currently around 3Mb/d.
--------------
During the 2008-2009 recession global oil demand fell by 2 Mb/d from 86 to 84Mb/d (chart 1). Global demand appears to have stabilized and is beginning to grow again. The charts in this post (click to enlarge) use monthly data and 12 month rolling averages to adjust for seasonality.
 Almost all the global decline was concentrated in developed OECD nations (chart 2). Less developed non-OECD nations such as China and India only saw a temporary stagnation and are now exhibiting growing demand again (chart 3).
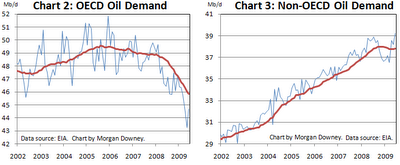 Of the OECD decline, one third came from the US, one third from OECD Europe, and one third came from the remaining developed OECD countries.
The US accounts for just under 23% and Europe 18% of 2009 global oil demand. Oil demand in the US and Europe has yet to stop falling (see charts 4 and 5).
 Oil demand in the US was destroyed more in absolute barrels over the past few years than in any other region.
The severe demand destruction in the US had a lot to do with current US oil consumption patterns (76% of Americans get to and from work by driving alone) and infrastructure (average US vehicle fleet efficiency is less than half that of available technology). Relatively inefficient consumption allows for swift efficiency gains compared with other parts of the world which are already at or close to maximum technically available oil consumption efficiency.
Looking at total US oil demand (chart 4) one may perceive that it is in a steady decline which can perhaps be extrapolated into the future. However, delving deeper into the data provides clues as to exactly why US demand is declining and why we may be at or quickly approaching the end of the decline in total US demand.
The total number of miles driven on US highways has stabilized and is increasing (chart 6).
 This stabilization and increase in highway miles driven is showing up in US gasoline demand which is no longer falling and has begun to grow again (chart 7). Gasoline demand accounts for almost half US oil consumption.
 The recovery in gasoline demand is because people are cutting back on vacation spending by driving rather than flying to holiday spots. This certainly syncs with the fall in jet fuel consumption (chart 8) and anecdotal evidence. Businesses have also been cutting back on flights.
 The decline in jet fuel consumption is more than offset by the increase in gasoline consumption. Combined, jet fuel and gasoline demand (together 57% of total US oil demand) are beginning to recover (chart 9).
 Where is the remaining weakness in US oil demand? It is in industrial oil demand. Demand for distillate (diesel and heating oil), residual fuel oil (mostly used for shipping and a little for electrical power generation) and other oils (lubes, waxes, asphalt, plastics and a bunch of other oils).
 Aggregating these three categories of US oil demand into “Industrial” demand, these industrial oils account for 43% of total US oil demand (chart 11).

To see a recovery in US industrial oil demand there would have to be a recovery in consumer spending (linked to unemployment, housing and the savings rate), manufacturing activity (especially autos), and private services sector activity. Most indicators in these macroeconomic areas have begun to stabilize and even improve over the past couple of months.
Conclusion: US industrial oil demand is currently the weakest part of global oil demand and the largest component of global oil demand yet to cease declining. Non-oil macroeconomic indicators suggest that an end to the decline in US industrial oil demand is imminent.
Despite the weakness in OECD oil demand and US industrial oil demand in particular, global oil demand has stabilized and begun growing due to non-OECD demand.
So why have oil prices stabilized in the US$65-75 per barrel range if the reduction in demand has been plumbed at 2Mb/d and the fall is over?
At the end of 2008 OPEC members removed close to 3Mb/d from supply. This was the amount required to stabilize and reduce OECD land based storage. OECD land based storage is the easiest storage to track.
The problem with focusing on OECD land based storage which is no longer increasing is that it ignores difficult to measure global floating storage and non-OECD land based tanks. Floating storage (see chart below) and non-OECD storage continue to creep higher. There needs to be an elimination of inventory growth in these difficult to measure areas in order to hold the prices gains witnessed in 2009.
This elimination of inventory growth can come from the recovery of global demand which appears to be just beginning or a further reduction in supply from OPEC. The number required is around 0.5Mb/d.
At the OPEC meeting this coming Wednesday, September 9, OPEC members have no choice but to maintain existing production cuts. In fact, until nascent global demand growth strengthens, OPEC members may need a temporary 0.5Mb/day improvement in cut compliance (compliance with 4.2Mb/d cuts announced in late 2008 is only around 3Mb/day) in order to stall the increases in floating and non-OECD storage, bring the global market into balance (a balanced market has inventories neither increasing nor decreasing) and hold onto 2009 price gains.
--------------
During the 2008-2009 recession global oil demand fell by 2 Mb/d from 86 to 84Mb/d (chart 1). Global demand appears to have stabilized and is beginning to grow again. The charts in this post (click to enlarge) use monthly data and 12 month rolling averages to adjust for seasonality.


The US accounts for just under 23% and Europe 18% of 2009 global oil demand. Oil demand in the US and Europe has yet to stop falling (see charts 4 and 5).

The severe demand destruction in the US had a lot to do with current US oil consumption patterns (76% of Americans get to and from work by driving alone) and infrastructure (average US vehicle fleet efficiency is less than half that of available technology). Relatively inefficient consumption allows for swift efficiency gains compared with other parts of the world which are already at or close to maximum technically available oil consumption efficiency.
Looking at total US oil demand (chart 4) one may perceive that it is in a steady decline which can perhaps be extrapolated into the future. However, delving deeper into the data provides clues as to exactly why US demand is declining and why we may be at or quickly approaching the end of the decline in total US demand.
The total number of miles driven on US highways has stabilized and is increasing (chart 6).


To see a recovery in US industrial oil demand there would have to be a recovery in consumer spending (linked to unemployment, housing and the savings rate), manufacturing activity (especially autos), and private services sector activity. Most indicators in these macroeconomic areas have begun to stabilize and even improve over the past couple of months.
Conclusion: US industrial oil demand is currently the weakest part of global oil demand and the largest component of global oil demand yet to cease declining. Non-oil macroeconomic indicators suggest that an end to the decline in US industrial oil demand is imminent.
Despite the weakness in OECD oil demand and US industrial oil demand in particular, global oil demand has stabilized and begun growing due to non-OECD demand.
So why have oil prices stabilized in the US$65-75 per barrel range if the reduction in demand has been plumbed at 2Mb/d and the fall is over?
At the end of 2008 OPEC members removed close to 3Mb/d from supply. This was the amount required to stabilize and reduce OECD land based storage. OECD land based storage is the easiest storage to track.
The problem with focusing on OECD land based storage which is no longer increasing is that it ignores difficult to measure global floating storage and non-OECD land based tanks. Floating storage (see chart below) and non-OECD storage continue to creep higher. There needs to be an elimination of inventory growth in these difficult to measure areas in order to hold the prices gains witnessed in 2009.
This elimination of inventory growth can come from the recovery of global demand which appears to be just beginning or a further reduction in supply from OPEC. The number required is around 0.5Mb/d.
At the OPEC meeting this coming Wednesday, September 9, OPEC members have no choice but to maintain existing production cuts. In fact, until nascent global demand growth strengthens, OPEC members may need a temporary 0.5Mb/day improvement in cut compliance (compliance with 4.2Mb/d cuts announced in late 2008 is only around 3Mb/day) in order to stall the increases in floating and non-OECD storage, bring the global market into balance (a balanced market has inventories neither increasing nor decreasing) and hold onto 2009 price gains.
Monday, August 10, 2009
Floating Storage Holds Oil Price Key
 (chart 1: model based on tanker data. click to enlarge)
Floating inventories should typically decline as demand picks up seasonally moving through the third and fourth quarter. Yet floating storage is increasing (see chart 1 above) to a new record high. Anecdotal evidence lends support to the above analysis.
 (chart 2 above: AG to USGC VLCC in US$ per barrel. click to enlarge)
Low freight rates (see chart 2 above) result from OPEC not using tankers they had been using last year when they were producing flat out. This provides the first and most important of a few key incentives to increase floating storage. Another incentive is the shape of the forward curve which needs to be in sufficiently upward sloping contango (see chart 3 below). Future prices have to be above today's price plus the cost of the tanker. There are also financing costs which need to be covered.
 (chart 3 above: NYMEX WTI Crude forward price curve. click to enlarge)
As OPEC increasing production will be the supply factor which ends the current oil price rally, changes in the above three charts may provide leading indicators to determine when oil prices have topped out and will begin to move sideways or fall.
Bear in mind that the above analysis is of the supply side of the oil market. As mentioned previously, above US$80 per barrel (oil spending equivalent to 4% of GDP) demand is likely to fall. OPEC may be able to created supply-driven price spikes above US$80 per barrel, but these are unlikely to last.
Thursday, May 28, 2009
Floating Storage Barrel Count
As expected today, OPEC members decided not to change output and crude oil (NYMEX WTI) hit a new high for the year of $65.44.
Some have said that equity market sentiment, dollar weakness or speculation have caused the recent run up in oil prices.
The relationship between equity markets and oil markets is mostly coincidental rather than there being a causal relationship (wealth effect of equity price movements may have a little causal effect). Equity market sentiment is driven by consumer and other demand-side activities which also impact oil demand.
Dollar weakness is a legitimate factor that can move oil prices in dollar terms. However this effect has been given too much credit for recent oil price moves (more on oil and dollar movement in a coming post).
Blaming speculators for oil price movements has become the most common face saving way of saying "I don't know." Speculation has been proven to have minimal impact on oil prices but is essential in generating liquidity and reducing transaction costs (bid/offer spreads) which reduces prices for consumers.
The main reason for the rally in oil prices has been quite simple. Oil is driven by fundamental physical supply and demand. Currently physical demand is greater than physical supply globally. Above ground oil inventories are no longer increasing and are beginning to fall. Now that we are coming close to the end of the weakest seasonal period for oil demand (second quarter of each year) we should see this oil inventory destocking pace rapidly increase.
Following is a chart of oil stored on floating tankers around the world. Floating storage is a leading indicator in the oil world as it is the most expensive place to store oil and the first to react to changes in fundamentals.

Some have said that equity market sentiment, dollar weakness or speculation have caused the recent run up in oil prices.
The relationship between equity markets and oil markets is mostly coincidental rather than there being a causal relationship (wealth effect of equity price movements may have a little causal effect). Equity market sentiment is driven by consumer and other demand-side activities which also impact oil demand.
Dollar weakness is a legitimate factor that can move oil prices in dollar terms. However this effect has been given too much credit for recent oil price moves (more on oil and dollar movement in a coming post).
Blaming speculators for oil price movements has become the most common face saving way of saying "I don't know." Speculation has been proven to have minimal impact on oil prices but is essential in generating liquidity and reducing transaction costs (bid/offer spreads) which reduces prices for consumers.
The main reason for the rally in oil prices has been quite simple. Oil is driven by fundamental physical supply and demand. Currently physical demand is greater than physical supply globally. Above ground oil inventories are no longer increasing and are beginning to fall. Now that we are coming close to the end of the weakest seasonal period for oil demand (second quarter of each year) we should see this oil inventory destocking pace rapidly increase.
Following is a chart of oil stored on floating tankers around the world. Floating storage is a leading indicator in the oil world as it is the most expensive place to store oil and the first to react to changes in fundamentals.

Floating storage beginning to empty is evidence that OPEC members' actions are having their desired effect. Storing oil on floating tankers is described in both the storage chapter and the transporting oil chapter of Oil 101.
[ Update June 7, 2009: A week after my analysis above showing crude floating storage declining a number of articles (DJN and Bloomberg for example) appeared confirming the analysis. ]
Subscribe to:
Posts (Atom)


 Posts
Posts

