Monday, November 30, 2009

End of the 2009 Hurricane Season

November 30 marks the end of Atlantic Hurricane Season which began back in June.  This has been an extremely mild season with only one (Hurricane Ida in early November) hurricane shutting down a small amount of US Gulf Coast oil and gas production for a few days.  Not a single hurricane made US landfall in 2009.

Comparing storm activity from one year to the next is a challenge.  Do you use lives lost, number of named storms, dollar damage, volume of oil and gas production shut in, or maximum intensity?

Taking a leaf from Google's attempt to analyze flu using words typed into its search engine, here are two charts which I am updating for the last time this year comparing the 2009 hurricane season to previous ones.  The first chart shows how many searches for the word "hurricane" were carried out over the past six years. The 2005 season which included Hurricane Katrina stands out.  Interestingly, the Google index registered a ZERO for the week up to November 29, 2009.  This is the first time the data showed no value.

(click chart to enlarge)

A second chart shows the same data as above, except in a cumulative form with the end of 2005 indexed to 100:

(click chart to enlarge)

The effects of seasonality on oil are described in Oil 101.

Downey City to Build Transport Future

It is often said that we need a 1960s Apollo Program Moon Shot type effort to meet future transport energy needs.

Coincidentally, the new Tesla electric car may be built in the same city which built the Apollo moon capsules: Downey, California.

Here is a video from ABC News describing the new plant. The AP describes the 7-seater sedan car as the "Model S, which is designed to travel as far as 300 miles on a three- to five-hour charge." Tesla currently produces an ultra-luxury electric 2-seater sports car which costs almost US$110,000. The new sedan is expected to cost around US$57,000. This is still expensive but as with most automotive technologies it tends to start in luxury vehicles before entering the mainstream.

Thursday, November 26, 2009

US Ethanol Decision Soon

As I mentioned at the beginning of May there is an oversupply issue with ethanol. Ethanol in the US is alcohol produced mostly from corn. US government mandated minimum ethanol volumes exceed what auto makers say most of their cars can handle. Typically cars can handle 10% ethanol blended with 90% petroleum-based gasoline without any special equipment.

The New York Times is reporting today that the US EPA may raise the US ethanol blend wall from 10% of gasoline to as high as 15% or 20% within the next week. Although such a change would be good for ethanol producers, this additional ethanol would displace petroleum-based gasoline and pressure oil refinery margins lower.

Update: On Tuesday December 1, 2009 the EPA announced it would defer making a decision on changing the US ethanol blend limit until mid-June 2010.

Wednesday, November 25, 2009

Happy Thanksgiving; enjoy the quiet airports

Thanksgiving is a big holiday in the US celebrated on the fourth Thursday of November each year. Is the travel associated with Thanksgiving significant for jet fuel demand? Not really.

The day before Thanksgiving is often incorrectly believed to be one of the busiest days for air travel in the US.  Here is an interesting story on the subject from CBS.

CNBC TV today

I appeared live on CNBC TV at 3:15pm New York time today to discuss commodities.

(click here to view on CNBC's site if it doesn't open below)


Update: As I predicted, within a week, on Tuesday December 1, 2009 spot gold traded above US$1,200 per troy ounce.

Tuesday, November 24, 2009

Is the Future of Transport in Niches?

Transport occurs in fairly stable patterns.  People commute to and from work, school and stores each day within a known range of miles and load. However, these stable patterns do not define the vehicles people buy. People tend to buy vehicles which cover a large array of contingencies.  Daily commuter vehicles are more often than not heavier than needed for a daily commute as they are purchased for events such as a once every month journey more than 200 miles with 6 people.  This contingency-link to vehicle purchasing creates a lot of fuel inefficiency.


(source: US Census Bureau)

As transport fuels become more diverse and expensive, powered transportation devices may also become more customized to fill niches.  These niche vehicles will be more efficient as they would just cover the vast majority of daily transport in the most efficienct manner.  Services such as car sharing Zip Car would meet the need for less frequent vehicle uses.

In cities, people tend to use taxis, subways and buses.  Taxis are expensive. Subways and buses, while most often the quickest way around, can be slow and infrequent at the edges of a city.

I was passing a motorcycle store the other day and saw this Ultra Motor A2B electric bicycle which can travel 20 miles at 20 miles per hour between charges.  It is an urban commuting vehicle.  One can pedal if the batteries have been drained.  The vehicle can be stored inside an apartment or an office which is an advantage over gasoline-powered scooters.  I am not endorsing this bike, it is simply interesting that products which would once have been considered gimmicks are now slowly at the edges of becoming more mainstream.

Monday, November 16, 2009

The Gold to Oil Ratio

In addition to fundamental supply and demand oil prices float against the US dollar. As the dollar weakens oil prices in dollars rise. This dollar weakness has accounted for some of the rally in oil prices since the 1990s.

(click image to enlarge)

Gold can be considered to be a currency just like the dollar or euro. Gold is at an all time high against the US dollar of US$1,135 per troy oz today. It is interesting that the price of oil in gold terms (1 troy oz currently buys 14.38 barrels) is at the bottom of the range in which it traded during the 1990s. In other words, oil in gold terms looks much less expensive than in US dollar terms.

(click image to enlarge)

Thursday, November 12, 2009

$500 Oil Calls Set Hyperinflation Probability

US oilman Boone Pickens said today  he thinks oil prices will be above US$100 per barrel at some stage during 2010 and US$300 within 10 years.

Pickens isn't alone in his bullish outlook.  Quite a few December 2015 NYMEX WTI crude oil US$500 strike call options have been purchased since the beginning of October this year (see chart below).

So someone out there thinks the probability of crude trading above US$500 per barrel by December 2015 is worth consideration at a value around US$1 per barrel.  That’s a big premium for a big oil number.

The oil market is placing a higher probability than other asset markets on the chance of outsized inflation.

(click chart to enlarge)

For more on oil options check out Chapter 19 of Oil 101.

Monday, November 9, 2009

Saudis Tap Brakes to Slow, Not Stall, Oil Rally

Saudi Aramco today announced that it will be increasing oil production slightly in December. This Saudi announcement is insufficient to bring the oil market into balance. The oil price rally of 2009 appears likely to continue, notwithstanding small corrections.

IEA to Public: You Can't Handle the Truth

An interesting news story this evening from the UK's Guardian newspaper which alleges that the International Energy Agency (IEA) changes forecasts to make them more rosy for oil consumers.  The IEA's annual World Energy Outlook (WEO) is used for energy planning by 30 OECD developed economies and is published tomorrow (Tuesday):
"The senior official claims the US has played an influential role in encouraging the watchdog to underplay the rate of decline from existing oil fields while overplaying the chances of finding new reserves.

The allegations raise serious questions about the accuracy of the organisation's latest World Energy Outlook on oil demand and supply to be published tomorrow – which is used by the British and many other governments..." (UK Guardian)
These are quite grave allegations by the Guardian as to who the IEA works for and to what end. OECD taxpayers fund it.

Sunday, November 8, 2009

World Oil Demand in Motion

When data is put in motion over time it becomes more interesting.  I have added World data to the Oil Demand Motion Chart. You can look at this chart any time from the link on the right side of this web site.  The oil data comes from the BP annual statistical review.  The population data is from the UN and the GDP data is from the World Bank.

Some interesting observations one can take from the chart are: 1. the evolution of oil demand in developing nations (click on Korea); 2. how developed nations oil consumption per capita is relatively stable (click on the US or UK); 3. that world oil demand has stuck at around 4.6 barrels per person for over 26 years despite huge population and economic changes over that time (discussed here previously).

I will be adding a lot more data to this chart over the coming weeks, especially some future oil demand scenarios.

The inspiration for the oil demand motion chart came from Fig. 1-13 on page 18 of Oil 101.

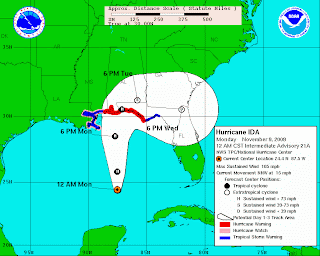
Hurricane Ida


(click here for updated Ida path)
This has been a very mild hurricane season for US Gulf Coast oil and gas production and refineries. Until yesterday there were no shut ins of production or refinery ouput due to hurricanes in 2009. Hurricane season ends on the last day of November and so Hurricane Ida is relatively late in the season. Ida is passing through an area in which oil and gas is produced and refined, which is why some companies are taking precautionary action.

Update: Monday Nov. 9th, 6:25pm. The US MMS says 384,642 barrels of oil production and 1.925 BCFD natural gas production shut in by Ida. This is roughly one quarter of US Gulf Coast offshore production.

Assuming no damage and that staff are back on platforms by Tuesday afternoon, it is likely that output will be shut down for a total of 2-3 days production. 

Click on the link here to see an amazingly detailed NASA image of the storm.

Thursday, November 5, 2009

Leading Edge Oil Demand Data

Is 2009 OECD oil demand destruction like 1974, when efficiency didn't stick, or the early 1980s, when efficiency almost bankrupted the oil industry? I have a much more detailed theory as to which version it is - which I will post at a later date. For now, let's dig into some data.

OECD oil demand growth is being written off by most oil analysts for the next few years. OECD demand growth is probably the most significant known unknown in the oil market. Early data indicates that we may be seeing signs of permanent OECD oil consumption efficiency. Given the huge numbers involved in OECD oil demand, it is worth teasing any data out for signs of how this efficiency is progressing and if it is lasting.

Automobile sales in the US are recovering (chart 1). The October sales numbers were at an annualized rate of 10.45 million units, up from 9.2 in September and 14.09 in August. The August number was prematurely high due to the cash for clunkers program which took place mostly in that month.

(click image to enlarge)

Now that the data dust of the cash for clunkers program has settled it is becoming clear that the mix between cars and SUVs/light truck sales is changing (chart 2). A higher share of car sales rather than heavier vehicles would tend to indicate that sticky changes in efficiency are occurring. Oil analysts factor these shifts into long term vehicles on the road when modeling oil demand. I speculated last month that the August cash for clunkers program had the effect of being a giant advertising program for efficient vehicles and would kick off this efficiency move.

(click image to enlarge)

What is interesting as an economic sidenote, but not so much for oil demand, is that US domestically produced automobiles appear to be gaining some ground (chart 3). Perhaps this is due to the weakness of the US dollar which makes imported vehicles more expensive as well as the recent report in an influential consumer survey of some US auto makers' vehicle quality improving.

(click image to enlarge)

Wednesday, November 4, 2009

How to Speak OPEC

As you may know from reading this blog, oil prices look like they will trade as high as US$95 before year end which will result in OPEC increasing production at their next scheduled meeting on December 22 in Angola. In other words, oil prices will continue higher until OPEC increases output.

OPEC have a relatively small amount of spare capacity and so once these production increases are done we will eventually see US$100+ oil again before the end of 2010.

Oil began 2009 close to US$30 per barrel. We are now at US$80 per barrel due to fundamental supply and demand. Oil bears have been blindsided in the past by an over-reliance on easy (OECD) data and OPEC double-speak. To help these oil bears out, here is a quick guide to the language of OPEC:

OPEC: Speculators are causing higher prices.
Means: OPEC wants, needs and causes higher prices by cutting output and creating an oil supply deficit. OPEC is the only group of oil producers with spare production capacity and has co-ordinated control of over 40% of global oil output - currently worth around US$3 billion per day, or US$90 billion per month.

OPEC: We think prices at US$70-US$80 are fair.
Means: OPEC will not increase oil production until oil trades above US$90 per barrel. OPEC members' target is US$70-$80, which means OPEC will increase production when oil trades above this range (perhaps to US$85-$95) to allow for some slippage. OPEC members do not want to encourage consumer efficiency or risk another recession with US$100+ oil, which is a psychologically important level for oil consumers.

OPEC: We cannot find buyers for our oil.
Means: OPEC members almost can't believe consumers are buying this line...but it actually worked when oil traded above US$100 last year because OPEC members had run out of spare capacity and were unable increase production.

OPEC: We do not want to increase production while OECD inventories are at record highs.
Means: Don't look at non-OECD inventories which are falling due to rapid demand growth in the developing world. Why do you think oil has risen from US$32 to US$80 over the past 10 months? If OPEC can keep consumers focussed on OECD inventories this allows OPEC to blame speculators and say "OECD inventories are high...it can only be speculators bidding oil prices up."

OPEC: Floating storage of oil is at record highs.
Means: It used to be that floating tankers were expensive and only used for storage when land-based tanks were full. Now these floating tanker owners are in such a bad way with a glut of tankers available that they are directly competing with land-based storage even though there is plenty of land based storage available. OPEC needs to point to any full barrel or container as an excuse not to increase production.

OPEC: We have almost 6 million bpd spare capacity.
Means: OPEC members have 2.5 million barrels per day (bpd) of spare capacity. The global oil consumer called OPEC members' stated spare capacity bluff in 2008.

Sunday, November 1, 2009

Oil Market Braces against Chill in the Air

Today was the first day cold enough in New York to require a coat. As we head into the Northern Hemisphere Winter chill it is worth putting seasonal heating in perspective.

The oil market splits the year into two seasons for heating purposes.
Winter is considered November through March. Summer is April through October.

The largest heating oil market in the World is in Western Europe followed by the US Northeast. Heating oil demand in Canada, Japan and Korea is also significant.

Winter Heating Oil Demand
(Click image to enlarge. Source: Oil 101, Table 13-2, Page 282)